The NANOGrav 15 yr Dataset: Search for Gravitational Scattering of Pulsars by Free-floating Objects in Interstellar Space

Lankeswar Dey, Ross J. Jennings, Jackson D. Taylor, Joseph Glaser, Maura A. McLaughlin, Gabriella Agazie, Akash Anumarlapudi, Anne M. Archibald, Zaven Arzoumanian, Paul T. Baker, and 41 others

The Astrophysical Journal997, 116, 12 pp.(2026)

Published 19 January 2026NANOGrav collaboration

doi:10.3847/1538-4357/ae279d

Figures

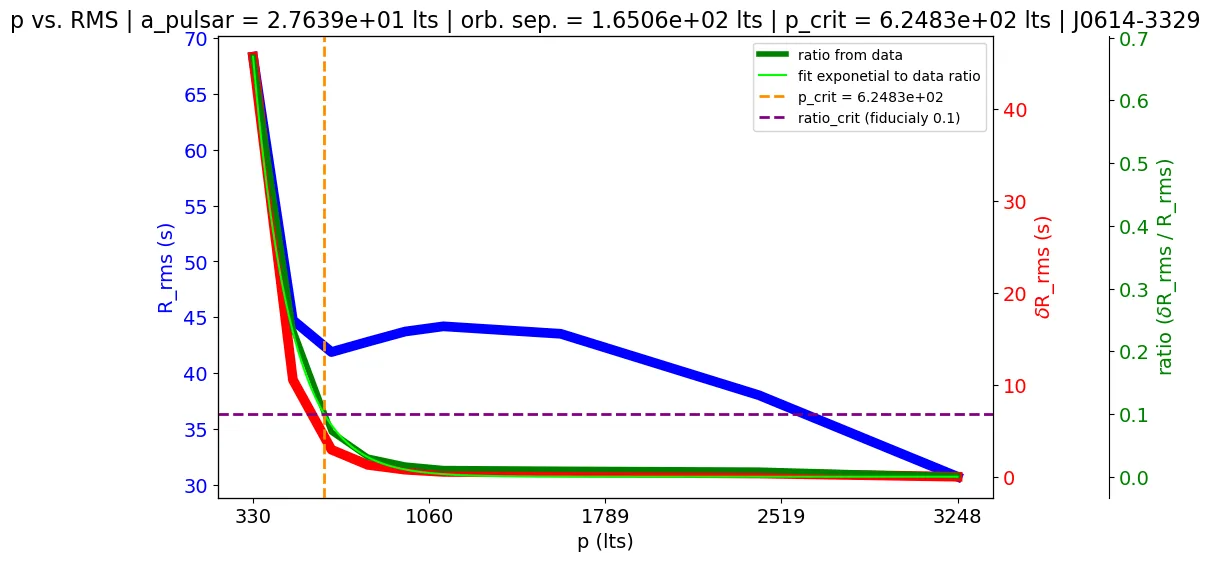
A plot for PSR J0614−3329. The horizontal axis is the closest distance a passing object would come, in light-seconds. The curves showing the extra scatter such a flyby would add to the pulse arrival times drop steeply over the first few hundred light-seconds and then flatten out. A vertical dashed line marks the critical distance of 625 light-seconds, where the added scatter falls to a tenth of the scatter already present in the data.
Figure 1.Past the critical distance, a passing object no longer leaves a mark this pulsar's timing could pick up. That distance sets how much space around each pulsar the search covers.
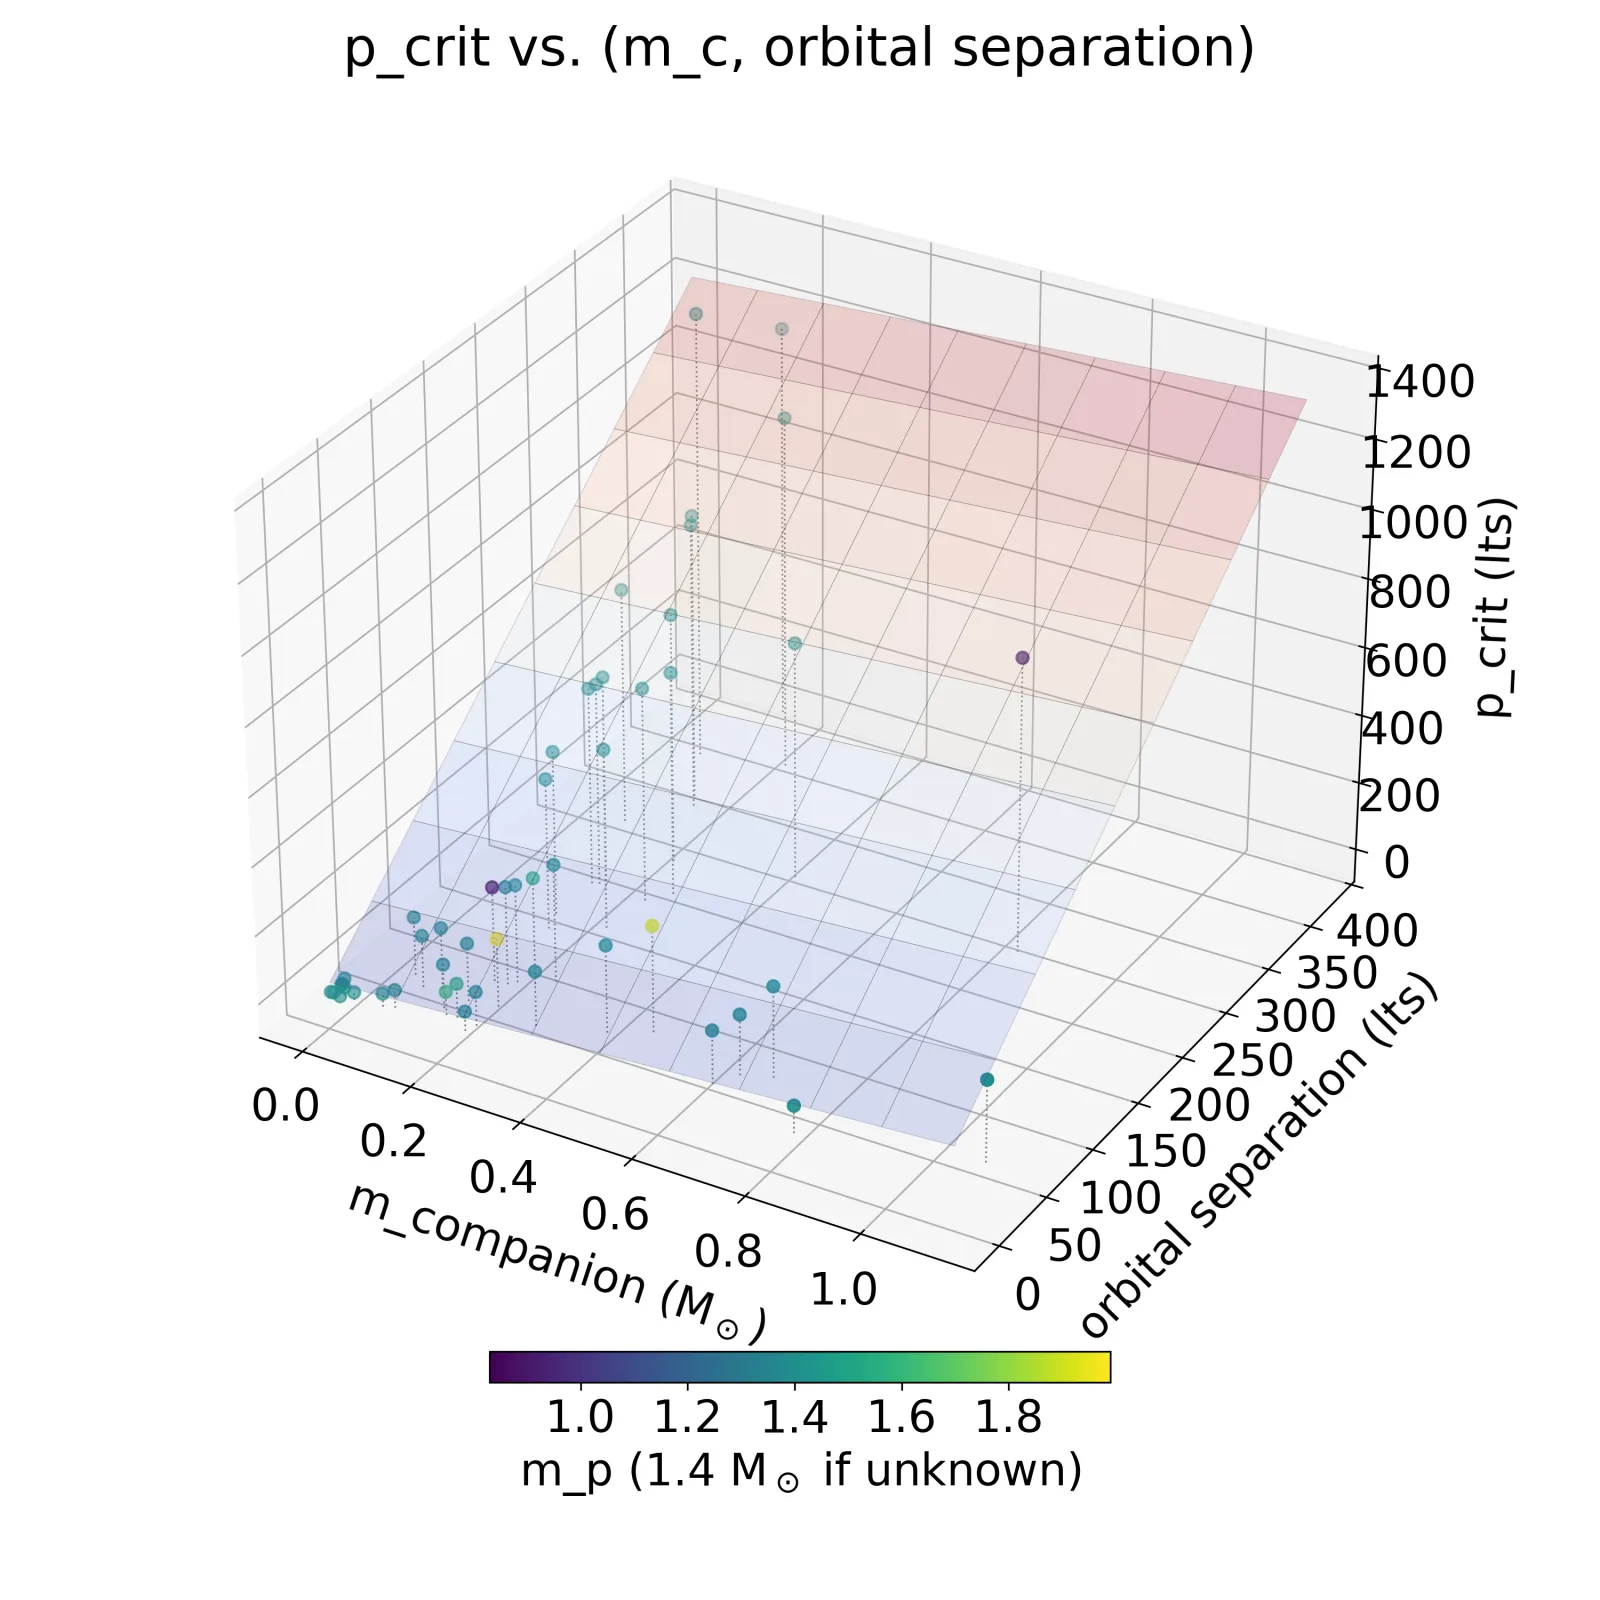
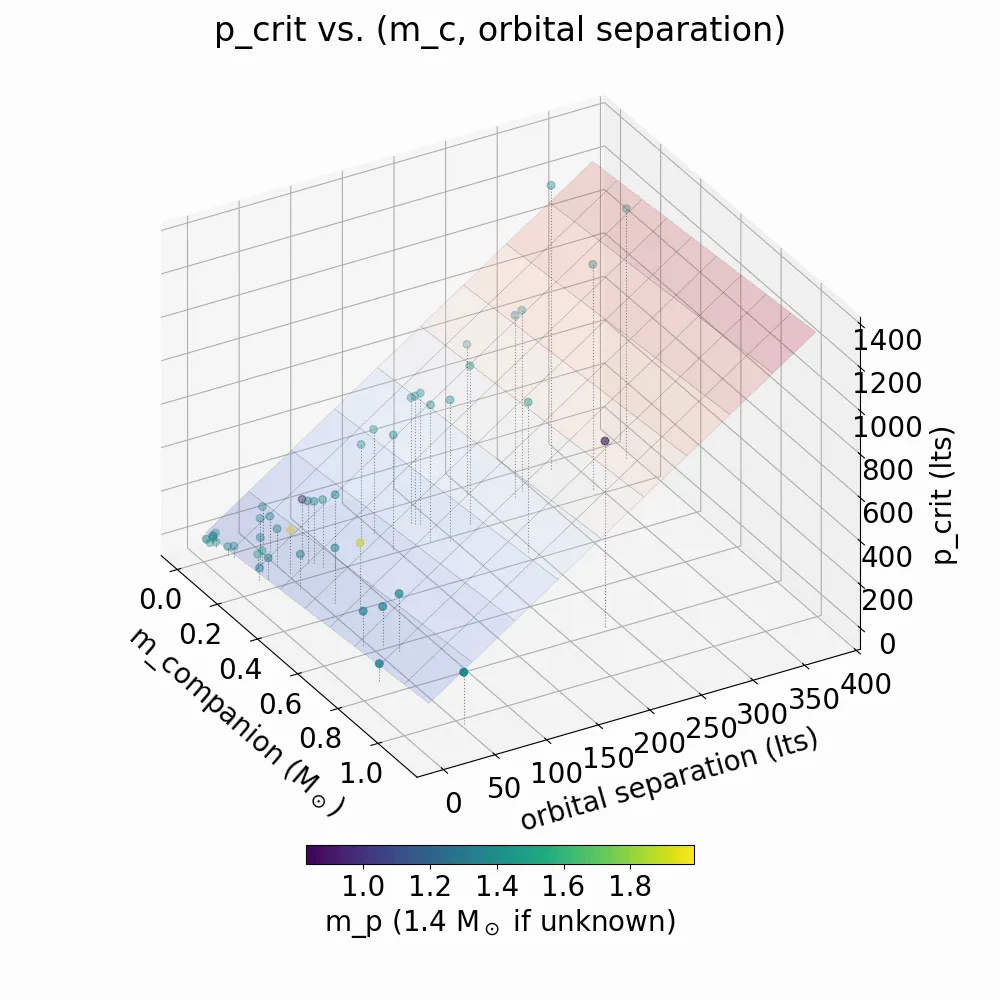
A three-dimensional plot of the critical distance against two properties of each binary pulsar: the mass of its companion and the separation of its orbit. A tilted plane rises from near zero to about 1,400 light-seconds as both quantities grow. The pulsars of the search are drawn as points around the plane, coloured by the mass of the pulsar itself.
Figure 2.Pulsars in wider orbits with heavier companions can be disturbed from further away, so each of them watches a larger volume of space.
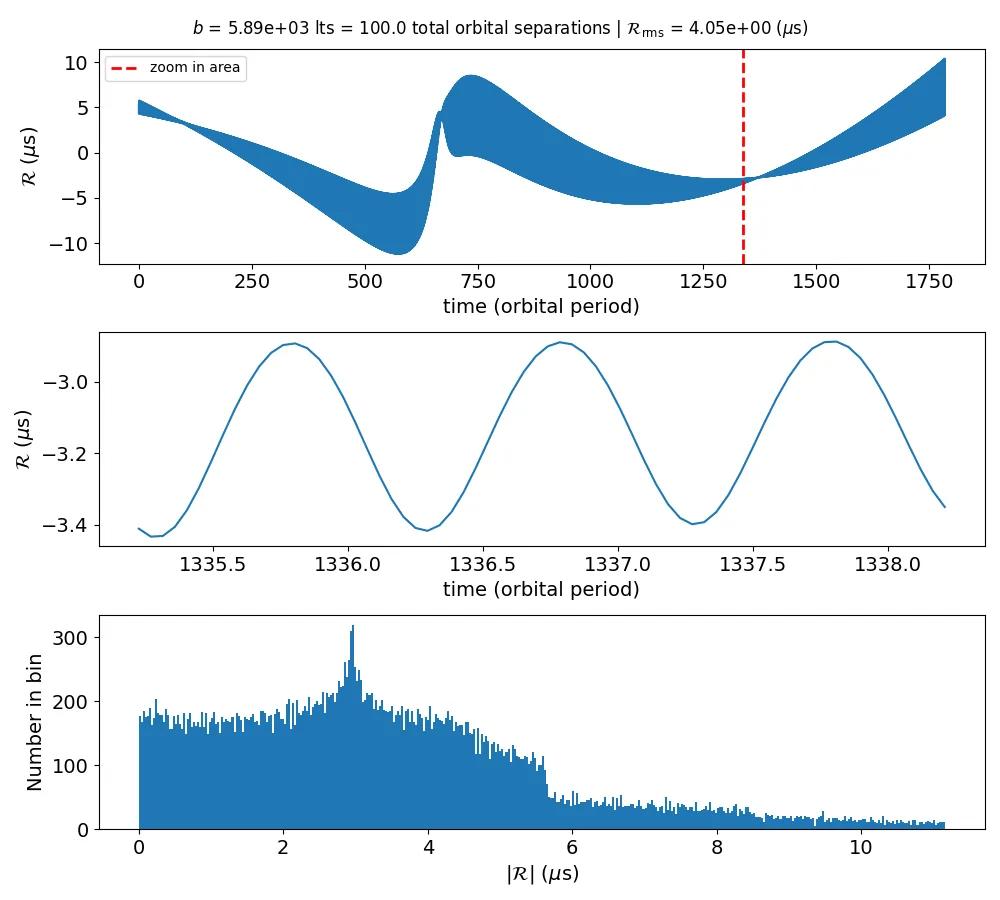
Three panels from a simulated flyby passing at 5,890 light-seconds. The top panel shows the timing residuals over roughly 1,800 orbits as a dense band a few microseconds wide that sags, jumps sharply upward partway through, then settles back. The middle panel zooms in on three orbits of the smooth wave underneath. The bottom panel is a histogram of residual size, peaking near three microseconds.
Figure 3.A flyby would show up in the data as a slow drift in the pulse arrival times, a kink at closest approach, then a slow recovery. The whole effect here is a few millionths of a second.
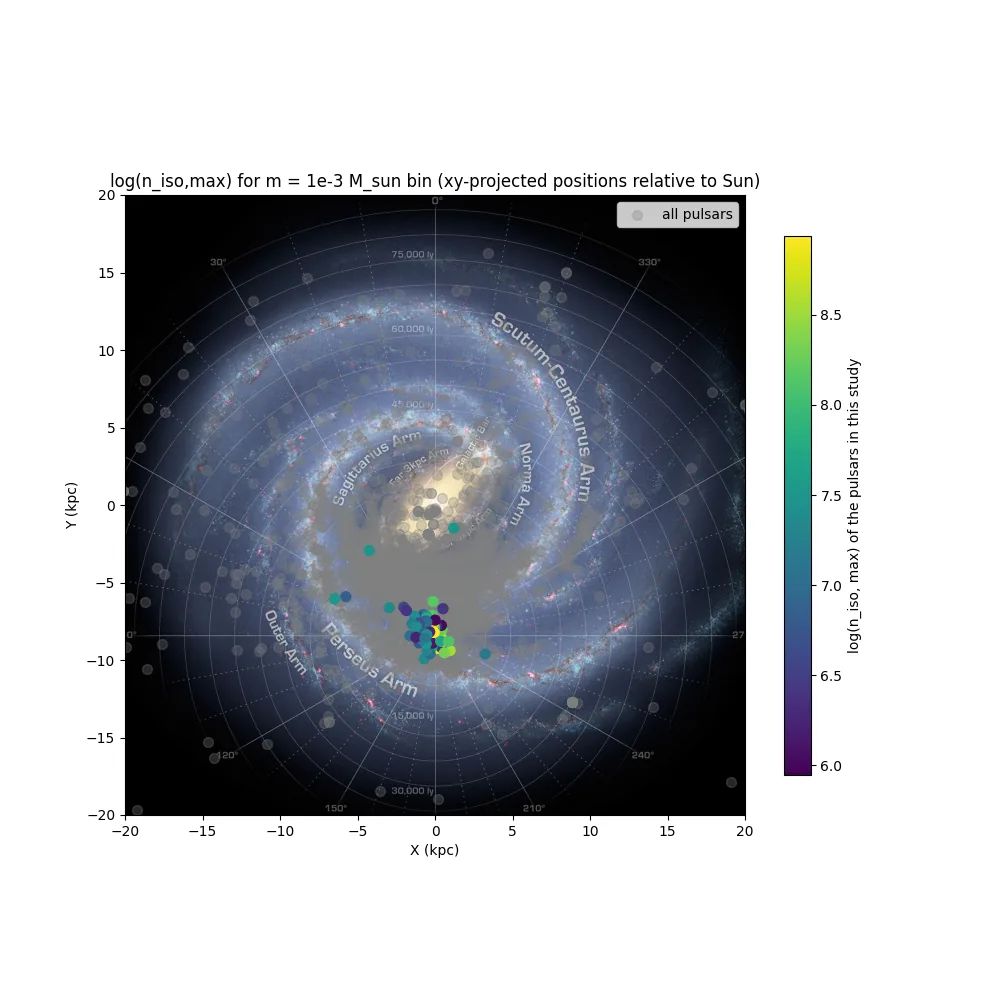
A top-down image of the Milky Way with pulsar positions plotted over it in kiloparsecs. Grey dots mark all known pulsars, scattered across the whole disc. Coloured dots mark the 68 pulsars used in this search, nearly all of them packed into a small region around the Sun's position, and coloured by the density limit each one sets.
Figure 4.The pulsars used here are all relatively close by, so the limits only apply to our own part of the Galaxy.
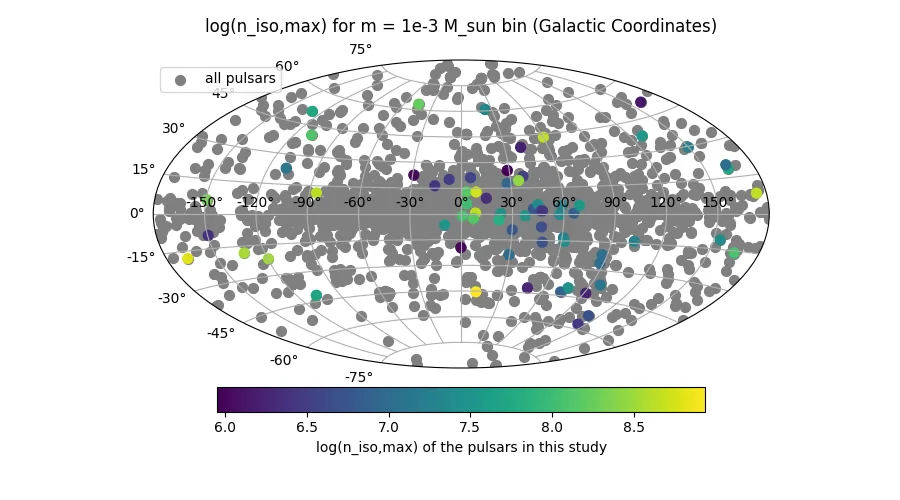
An oval all-sky map in Galactic coordinates. Grey dots, marking all known pulsars, bunch tightly along the plane of the Milky Way through the middle of the oval. Coloured dots, the 68 pulsars in this search, are spread far more evenly across the whole sky and coloured by the limit each one sets.
Figure 5.Most pulsars are found along the Galactic plane, but the millisecond pulsars timed precisely enough for this search sit all over the sky.
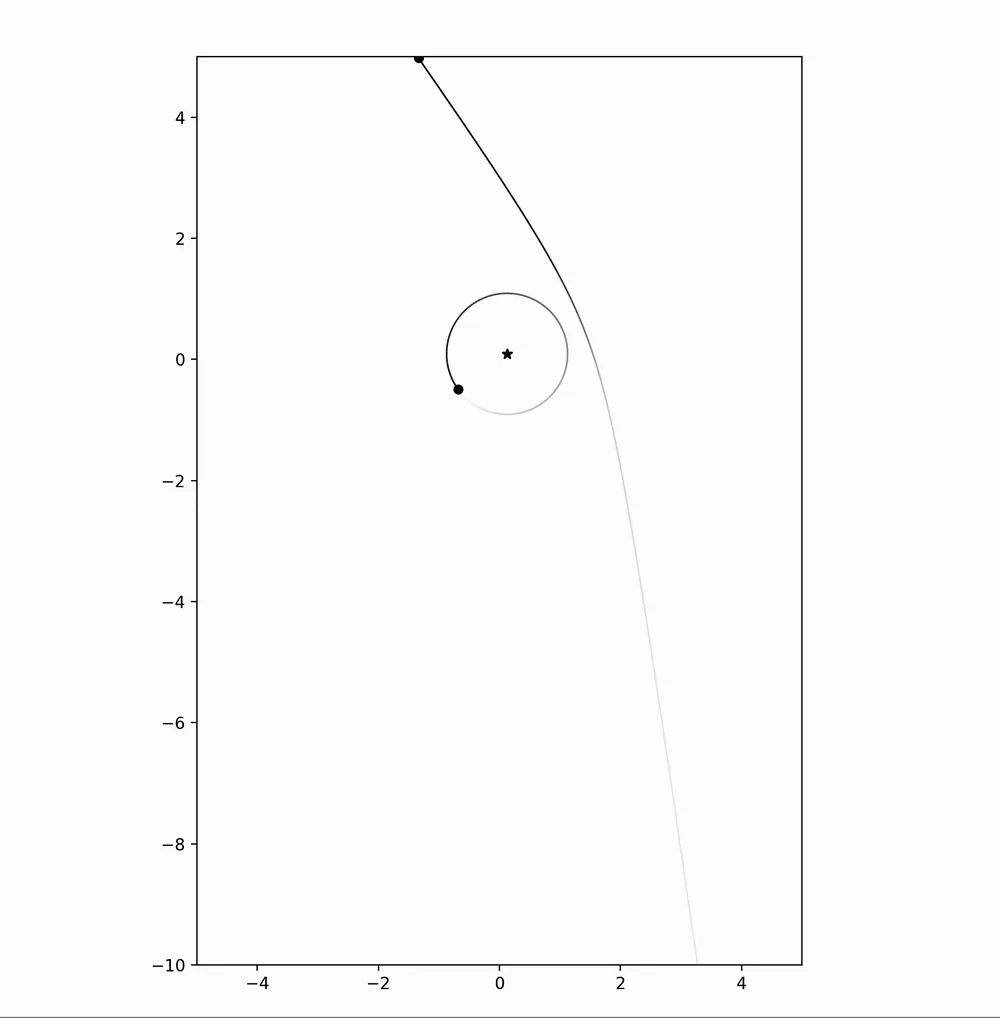
An animation of a flyby. A star sits at the centre with a companion on a small circular orbit around it. A second body comes in from the bottom of the frame on a fading track, bends sharply as it rounds the star at closest approach, and leaves in a new direction off the top.
Figure 6.A hyperbolic flyby. The passing object is deflected, and the star is pulled in return by a far smaller amount. That return tug is what would show up in the pulse arrival times.An animation of a flyby. A star sits at the centre with a companion on a small circular orbit around it. A second body comes in from the bottom of the frame on a fading track, bends sharply as it rounds the star at closest approach, and leaves in a new direction off the top.Download the video
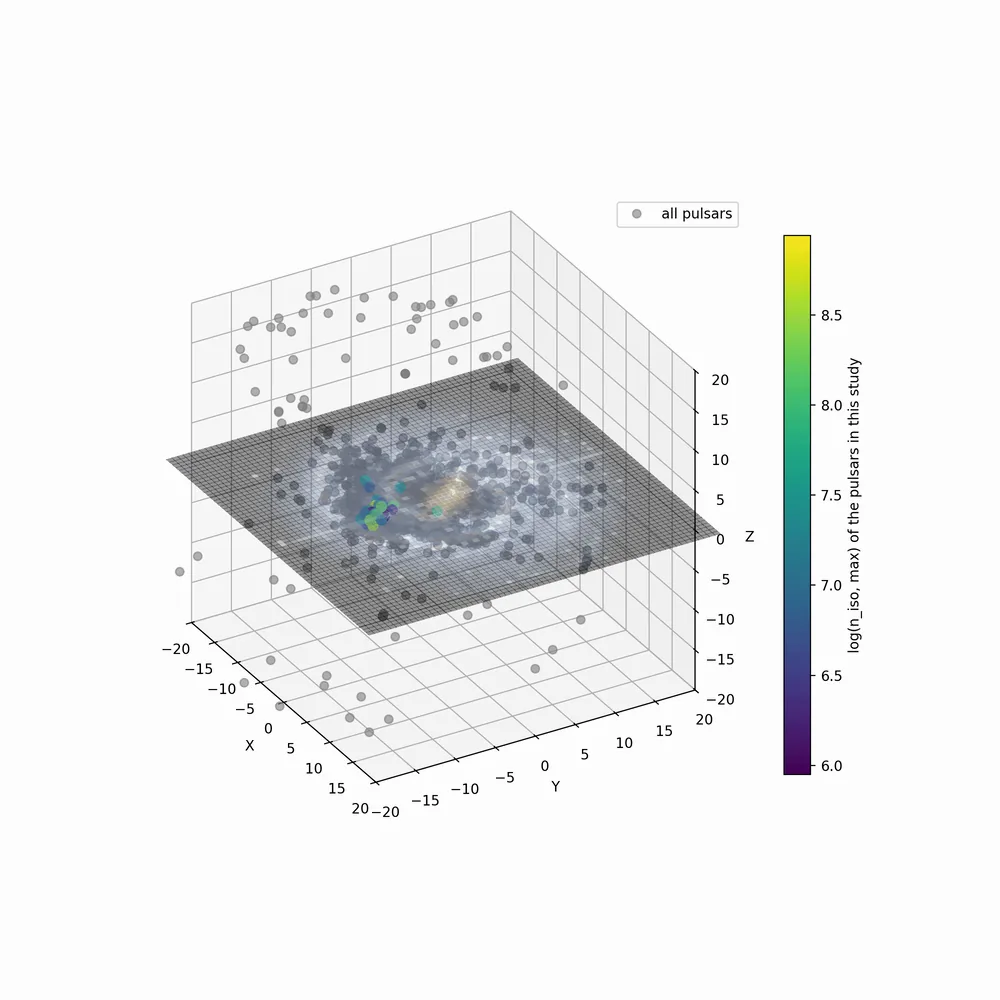
A slowly rotating three-dimensional plot with an image of the Milky Way laid flat as a plane through the middle. Grey dots are all known pulsars, sitting above and below the disc. Coloured dots are the pulsars used in this search, clustered close to the Sun and coloured by the density limit each one sets.
Figure 7.Each of the 68 pulsars gives its own limit on how many free-floating objects can be packed into a cubic parsec. The colours are those individual limits.A slowly rotating three-dimensional plot with an image of the Milky Way laid flat as a plane through the middle. Grey dots are all known pulsars, sitting above and below the disc. Coloured dots are the pulsars used in this search, clustered close to the Sun and coloured by the density limit each one sets.Download the video
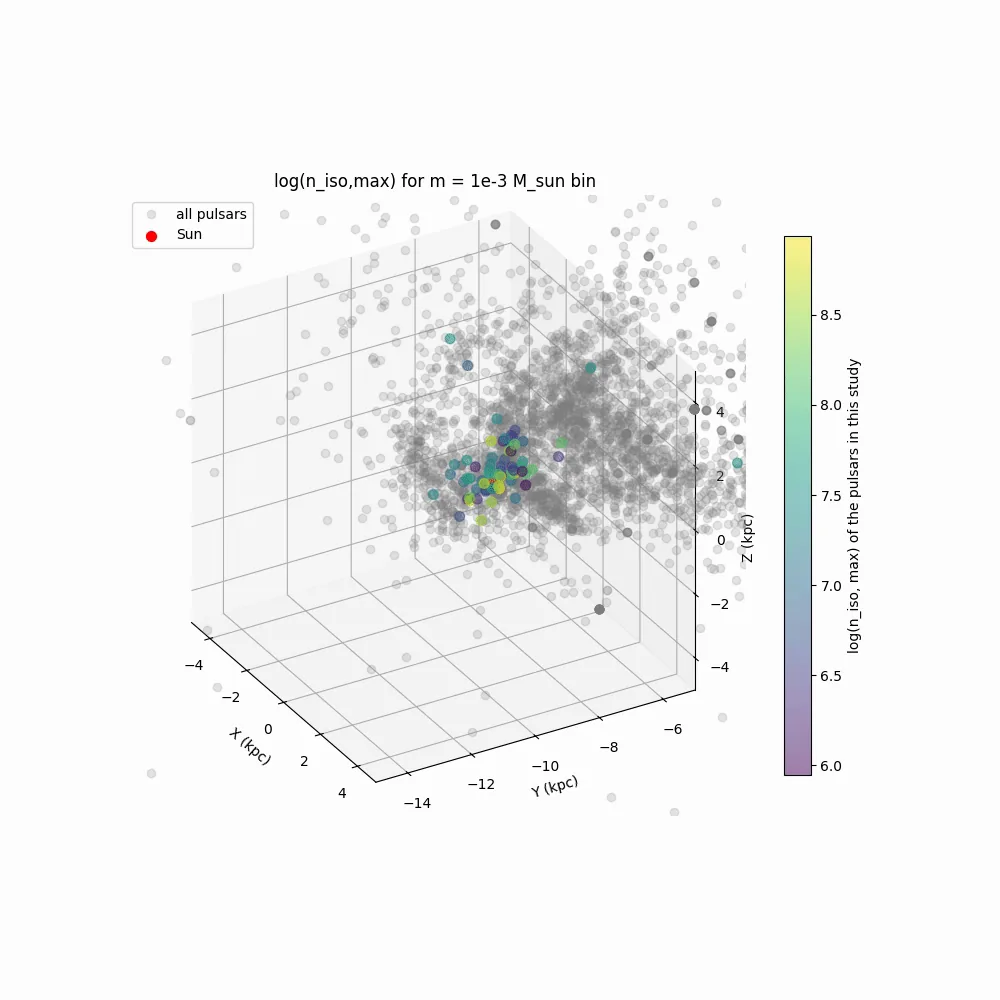
A rotating three-dimensional box a few kiloparsecs across, centred on the Sun's neighbourhood. Faint grey dots are all known pulsars in that volume. The coloured dots are the pulsars used in this search, coloured by the limit each one sets.
Figure 8.A rotating three-dimensional box a few kiloparsecs across, centred on the Sun's neighbourhood. Faint grey dots are all known pulsars in that volume. The coloured dots are the pulsars used in this search, coloured by the limit each one sets.Download the video
A rotating view of the critical-distance surface: the closest approach at which a passing object would still disturb the timing, plotted against each binary's companion mass and orbital separation, with the pulsars of the search shown as points around the surface.
Figure 9.A rotating view of the critical-distance surface: the closest approach at which a passing object would still disturb the timing, plotted against each binary's companion mass and orbital separation, with the pulsars of the search shown as points around the surface.Download the video
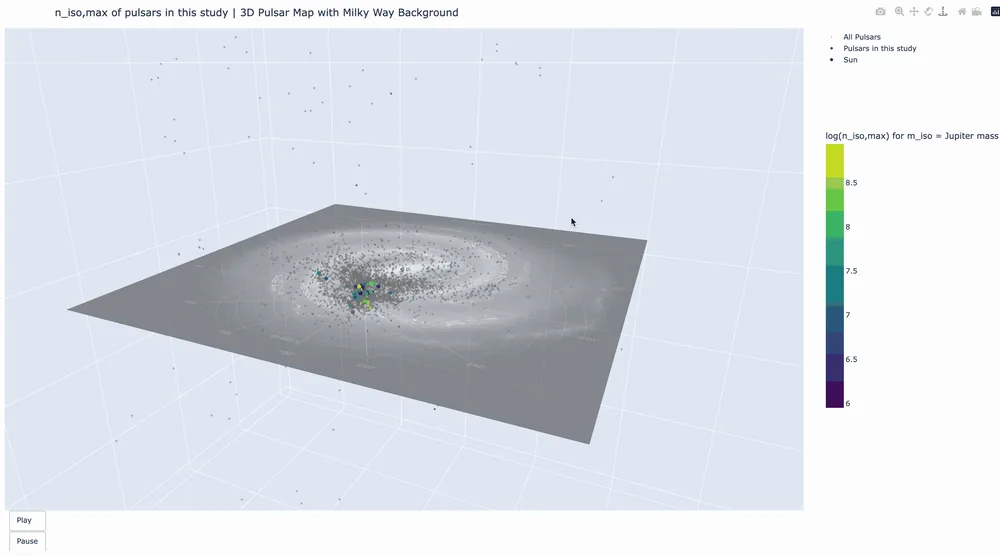
A three-dimensional map of pulsar positions turning slowly, with a grey image of the Milky Way as the background plane. Small grey points are all known pulsars. The larger coloured points are the pulsars in this search, coloured by the limit each one sets on the number of Jupiter-mass free-floating objects per cubic parsec.
Figure 10.A three-dimensional map of pulsar positions turning slowly, with a grey image of the Milky Way as the background plane. Small grey points are all known pulsars. The larger coloured points are the pulsars in this search, coloured by the limit each one sets on the number of Jupiter-mass free-floating objects per cubic parsec.Download the video

Abstract

Free-floating objects (FFOs) in interstellar space—rogue planets, brown dwarfs, and large asteroids that are not gravitationally bound to any star—are expected to be ubiquitous throughout the Milky Way. Recent microlensing surveys have discovered several free-floating planets that are not bound to any known stellar systems. Additionally, three interstellar objects, namely 1I/’Oumuamua, 2I/Borisov, and 3I/ATLAS, have been detected passing through our solar system on hyperbolic trajectories. In this work, we search for FFOs on hyperbolic orbits that pass near millisecond pulsars (MSPs), where their gravitational influence can induce detectable perturbations in pulse arrival times. Using the NANOGrav 15 yr narrow band dataset, which contains high-precision timing data for 68 MSPs, we conduct a search for such hyperbolic scattering events between FFOs and pulsars. Although no statistically significant events were detected, this nondetection enables us to place upper limits (ULs) on the number density of FFOs as a function of their mass within our local region of the Galaxy. For example, the UL on the number density for Jupiter-mass FFOs (∼10^−2.5–10^−3.5 M⊙) obtained from different pulsars ranges from 5.25 × 10^6 pc^−3 to 5.37 × 10^9 pc^−3, while the UL calculated by combining results from all the pulsars is 6.03 × 10^5 pc^−3. These results represent the first constraints on FFO population derived from pulsar timing data.

All publications